The objective of these measurements is to be able to anticipate how a loudspeaker might sound in a normally reflective room. No single curve can sufficiently describe how a loudspeaker might sound in a normally reflective room. To better predict its sound, many measurements shall be made at multiple positions surrounding the loudspeaker. These data shall then be processed to estimate the direct, early-reflected and late-reflected sound in a typical small listening room.
...
Kap 13 Estimating In-Room Response from Anechoic Data:
The Estimated In-Room Response shall be calculated using the directivity data acquired in Section 5 or Section 6. It shall be comprised of a weighted average of 12 % Listening Window, 44 %, Early Reflections, and 44 % Sound Power. ...
Research has led to an understanding of how important the direct, early and late reflected sounds are to listeners in small rooms. Consequently, these are the factors to examine in post processing of the raw data.
...
The on-axis frequency response is the universal starting point and in many situations it is a fair representation of the first sound to arrive at a listener’s ears. However, as shown in the Devantier (2002) survey, over half of those investigated had the prime listening position 10º to 20º off axis. A further reason to question the value of this single on-axis curve is that, in some (mostly horizontally symmetrical) loudspeakers, it is contaminated by acoustical interference irregularities that do not exist at other angles. This has special consequences when this curve is used as a reference for normalization or for the calculation of Directivity Index – these single-axis irregularities which are very likely inaudible in a room, cause derived metrics to be distorted in an unrealistic way. For all of these reasons it was decided to consider the following measure as a more realistic indicator of “direct sound” in a normal listening situation.
The listening window is a spatial average of the nine amplitude responses in the ±10º vertical and ±30º horizontal angular range. This encompasses those listeners who sit within a typical home theater audience, as well as those who disregard the normal rules when listening alone. Because it is a spatial average, this curve attenuates small fluctuations caused by acoustical interference, something far more offensive to the eye than to the ear, and reveals evidence of resonances, something to which the ear is very sensitive. Interference effects change with microphone position and are attenuated by the spatial averaging, while resonances tend to radiate similarly over large angular ranges, and remain after averaging. Bumps in spatially-averaged curves tend to be caused by resonances
The early reflections curve is an estimate of all single-bounce, first-reflections, in a typical listening room. Measurements were made of early reflection “rays” in 15 domestic listening rooms. From these data a formula was developed for combining selected data from the 70 measurements in order to develop an estimate of the first-reflections arriving at the listening location in an “average” room (Devantier, 2002). It is the average of the following:oFloor bounce: average of 20º, 30º, 40º downoCeiling bounce: average of 40º, 50º, 60º upoFront wall bounce: average of 0º, ± 10º, ± 20º, ± 30º horizontaloSide wall bounces: average of ± 40º, ± 50º, ± 60º, ± 70º, ± 80º horizontaloRear wall bounces: average of 180º, ± 90º horizontal
Vertical reflections. The “floor reflection” is defined as the spatial average of three measurements at 30 degrees below the main-axis ± 10 degrees. The “ceiling reflection” is defined as the spatial average of three measurements at 50 degrees above the main-axis ± 10 degrees.•Horizontal reflections. The following three spatial averages are defined:1. “Front” is the average of seven measurements at 0 degrees ±30 degrees.2. “Side” is defined as the average of ten measurements at 60 degrees ± 20 degrees to either side. 3. “Rear” is defined as the average of 19 measurements at 180 degrees off the main-axis ±90 degrees (i.e.: the horizontal part of the rear hemisphere).
Sound power represents all of the sounds arriving at the listening position after any number of reflections from any direction. It is the weighted rms average of all 70 measurements, with individual measurements weighted according to the portion of the spherical surface that they represent.
Sound Power Directivity Index (SPDI) is normally defined as the difference between the on-axis curve and the sound-power curve, expressed in dB
Early Reflections Directivity index (ERDI) is defined as the difference between the listening window curve and the early reflections curve.
....
In theory, with complete 360-degree anechoic data on a loudspeaker and sufficient acoustical and geometrical data on the listening room and its layout it would be possible to estimate with good precision what would be measured by an omnidirectional microphone located in the listening area of that room
..
For these limited circumstances it has been found that a usefully accurate Predicted In-Room (PIR) amplitude response, also known as a “room curve” is obtained by a weighted average consisting of 12 % listening window, 44 % early reflections and 44 % sound power. At very high frequencies errors can creep in because of excessive absorption, microphone directivity, and room geometry. These discrepancies are not considered to be of great importance. Free-field data of the kind shown in Figure 4 are generally trustworthy indicators of performance at very high frequencies.
..
Figure 11 shows a comparison in which the agreement is impressive above the transition/Schroeder frequency for the room (300 Hz to 400 Hz). At lower frequencies it is clear that the PIR cannot anticipate the effects of room modes and standing waves, although an underlying trend seems to be evident.
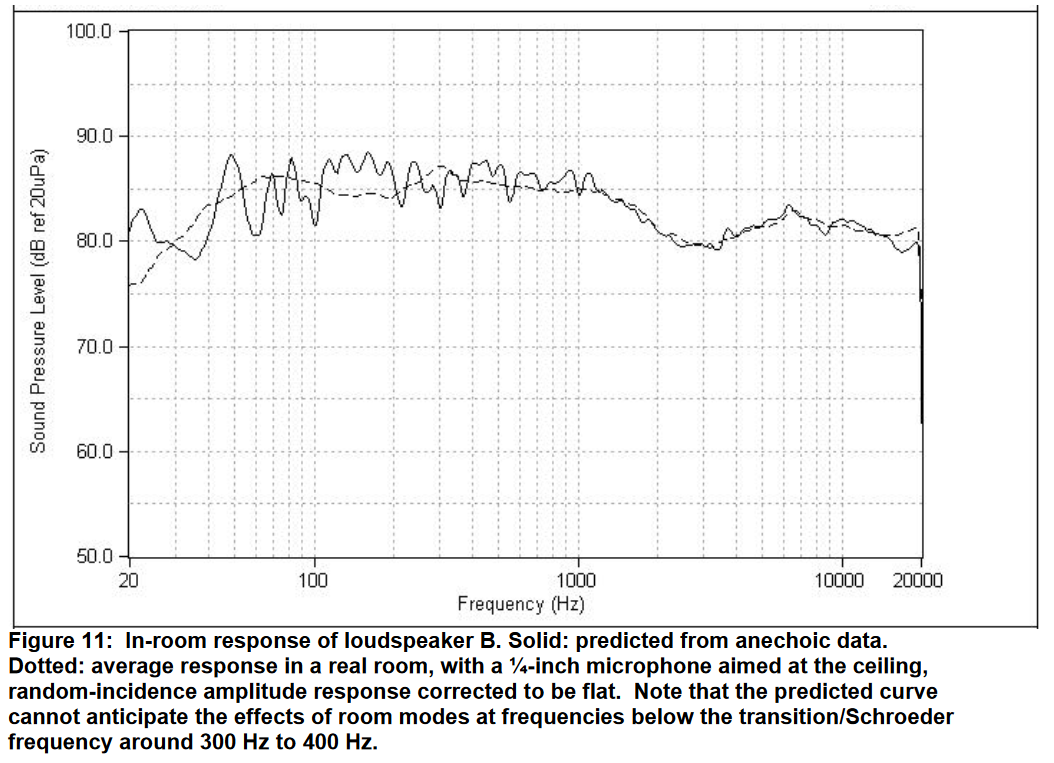
- Figure_11-CTA-2024.png (319.85 KiB) Visad 3704 gånger
Från:
https://www.audiosciencereview.com/foru ... pdf.45978/


